This week we discussed MADE (Germain et al., 2015 [1]) and NADE (Uria et al., 2016 [2]), two papers on autoregressive distribution estimation. The two papers take a similar approach to estimating the distributions of data. Namely, they modify the structure of autoencoder neural networks to yield properly normalized, autoregressive models. NADE, first introduced in 2011, lays the groundwork for these models. MADE extends these ideas to deep networks with binary data. The recent, journal paper on NADE further extends these ideas to real valued data, explores more interesting network architectures, and performs more extensive experiments.
The figures and algorithms below are taken from the aforementioned papers.
Distribution Estimation
Set up
Given a set of examples , where , the goal is to estimate a joint distribution . This distribution quantifies the statistical properties of data and can be used as a generative model to sample new data. This generative model is useful in many applications such as classification, data denoising or missing data completion. This problem is relatively easy if the dimensionality of the data is low (e.g., estimate distribution from many examples of real valued numbers). However, in cases when data is high dimensional (e.g., space of pixels of an image), estimation of the data distribution becomes difficult. The main problem is that as dimensionality increases the volume of the space the distribution needs to cover increases exponentially, making it harder for finite datasets to give a clear picture of the statistical properties of that space.
Autoencoder neural networks:
One powerful idea to estimate the distribution of data is to utilize the power of neural networks as function approximators. In this setting, a neural network learns a feed-forward representation of the input data examples in its hidden layers with the goal of regenerating the input data as accurately as possible. These hidden representations can thus reveal the statistical structures of the data generative distribution. For example, to learn the representation of binary data using a one-layer network, we can frame the problem as follows:
where is the hidden layer nonlinear activation function, and are network input-to-hidden and hidden-to-output weights, respectively, and and are the bias terms. The main advantage of this framework is that it is very flexible and easy to train to find the best parameters with stochastic gradient descent. The typical loss function used if data is binary is the cross-entropy:
The output of the network, , is interpreted as the probability that the -th output is one, i.e. . From this perspective, the network maps an input to a collection of probabilities, and the loss represents the log likelihood of the data under an independent Bernoulli noise model. It is tempting to interpret as a negative log probability of . However, is not a proper probability mass function; it is non-negative but it does not sum to one. Normalizing it would require an intractable sum over all inputs. Moreover, in the general case of fully connected network, this is not an ideal approach to density estimation. The main confound is that in a fully connected network the generative process of data at dimension depends on the input data at dimensions . Thus, with enough hidden units, the network can learn a trivial map that simply copies the input data to the output (i.e., there is a trivial set of weight that assigns arbitrarily close to one when equals one and arbitrarily close to zero otherwise). One can see that in the trivial case of copying the input to the output, for all , and hence after normalization, the output would be the uniform distribution. NADE ad MADE address these two issues by placing restrictions on the autoencoder network.
Distribution estimation with autoregression:
The decomposition of joint distributions to product of conditions gives a solution to the above problem. In general, the joint distribution over data can be written in the form of conditional product as follows:
Remember the main problem of the autoencoders is that depends on all ’s due to the full connections in the neural network. However, if the connections are modified to satisfy this autoregressive property, this will eliminate the possibilities of trivial representations and will allow the network to learn a proper joint distribution. The loss function becomes then a valid negative log probability:
Masked Autoencoder for Distribution Estimation (MADE)
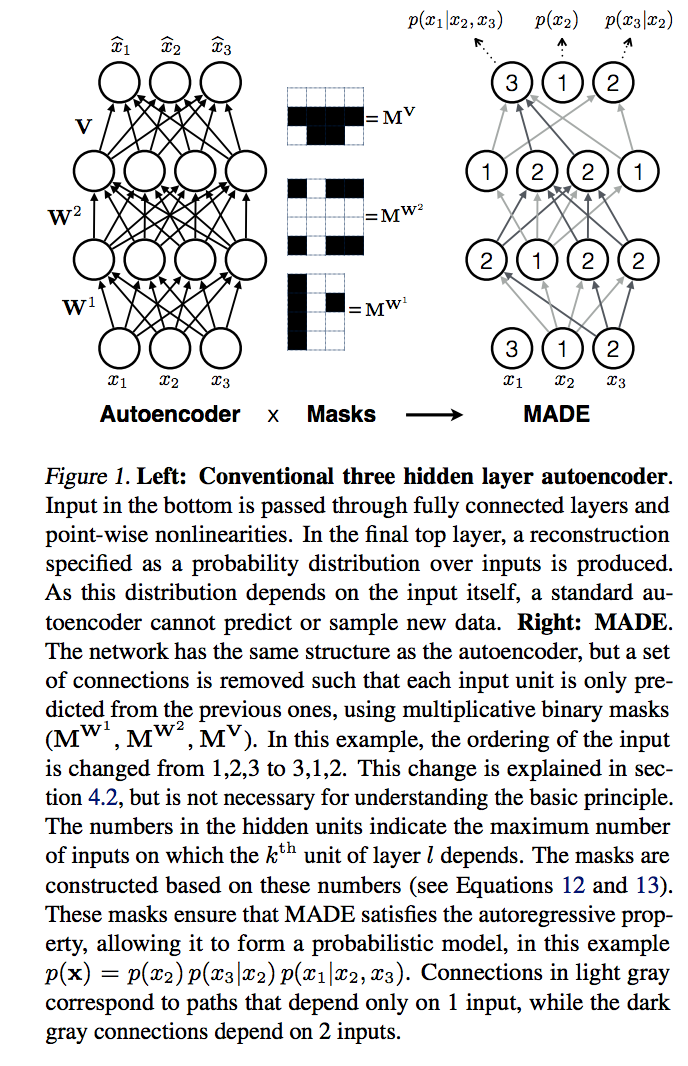
The main idea of MADE is to modify the connections in the autoencoder to satisfy the autoregressive property using masked weights. To enforce that there are no dependencies between and , MADE ensures there is no computational paths between and by multiply the network weight by masks as follows:
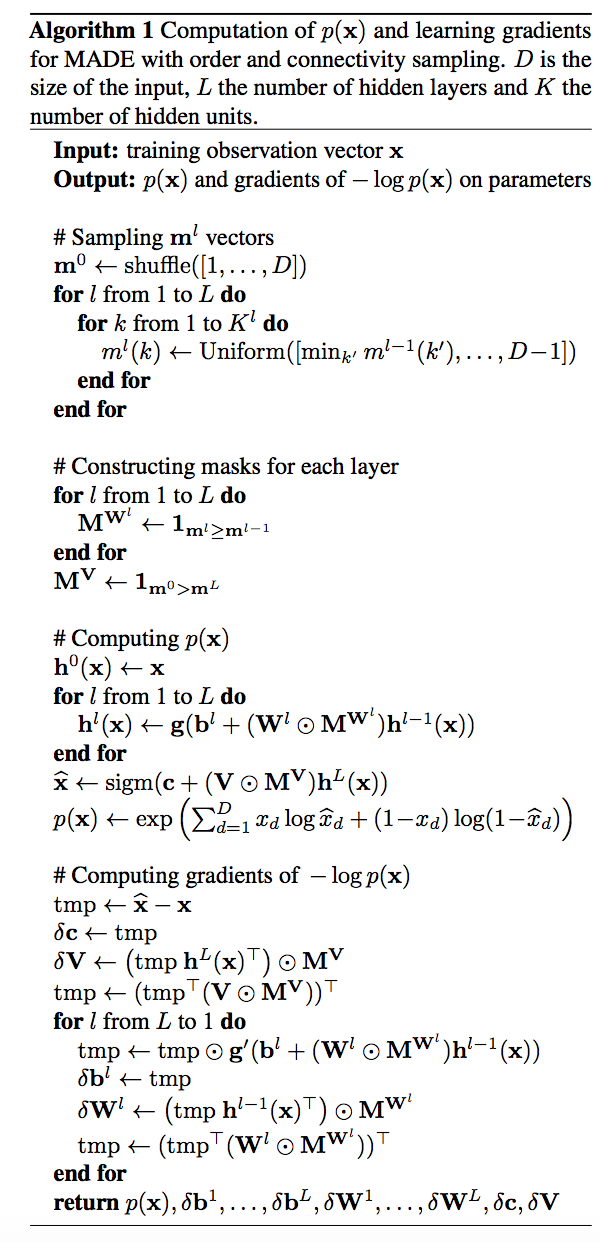
where and are mask matrices. The matrix product of and represents the number of computational paths from the input to the output in this one-layer network. Thus, to satisfy the autoregressive property, we need to choose and such that the matrix is lower triangle. That is there is no computational paths between and . The same framework generalizes to deep networks with more than one hidden layer by ensuring the product of the masks have a lower triangular structure (Figure 1). The procedure is detailed in Algorithm 1. MADE focused entirely on estimation the distribution of only binary data.
Neural Auroregressive Distribution Estimation (NADE)
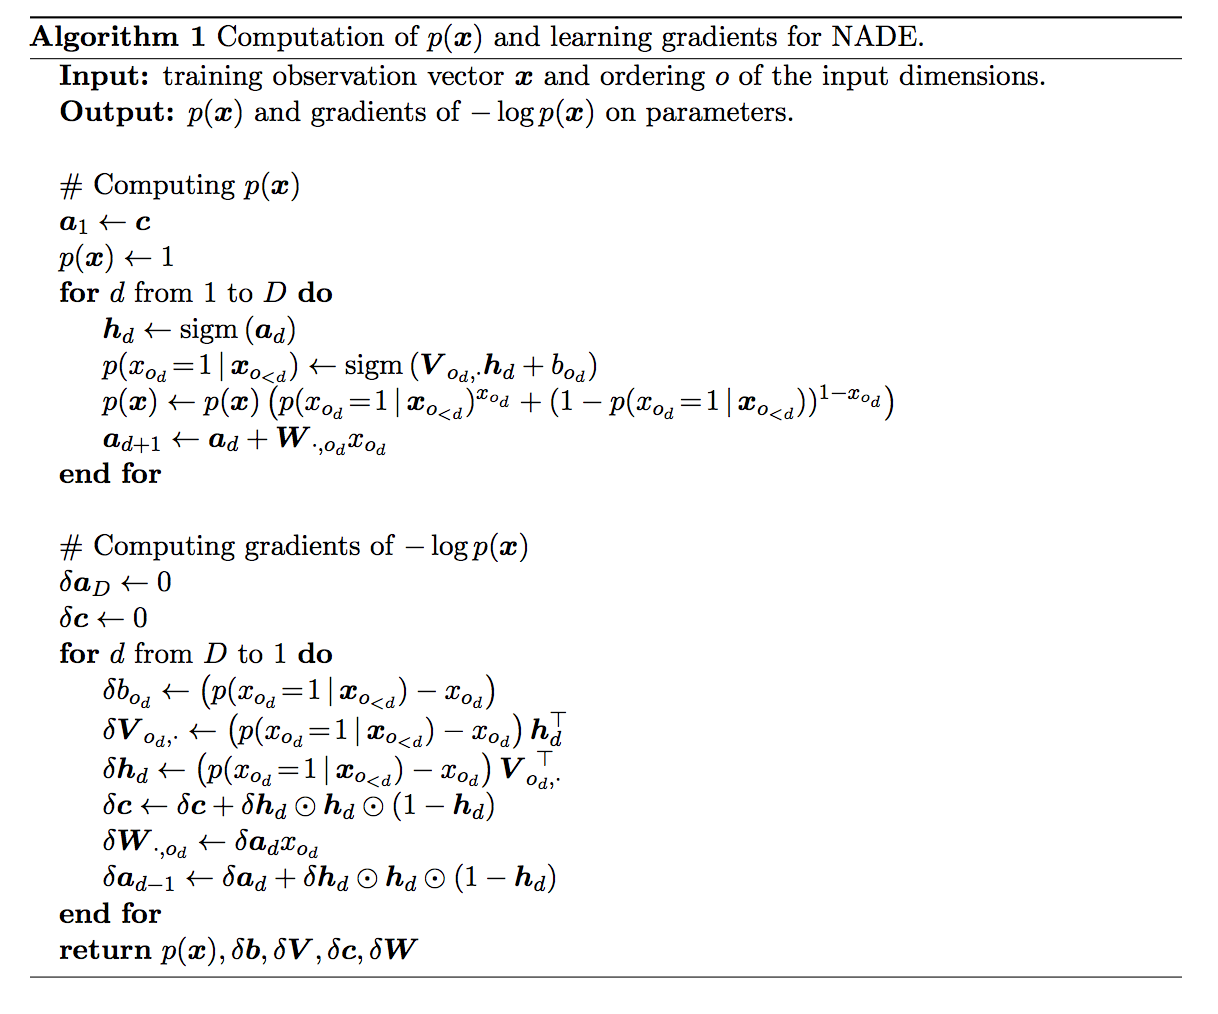
The same approach of utilizing the autoregressive property by modifying the autoencoder weights is also adopted in NADE except that NADE uses fixed set of masks (NADE algorithm 1 and Figure 1) whereas in MADE masks are allowed to change.
One major extension of NADE over MADE is its ability to handle real valued data by modifying the model to the Gaussian-RBM (Welling et al., [3]). That is each of the conditionals is modeled by a mixture of Gaussians as follows:
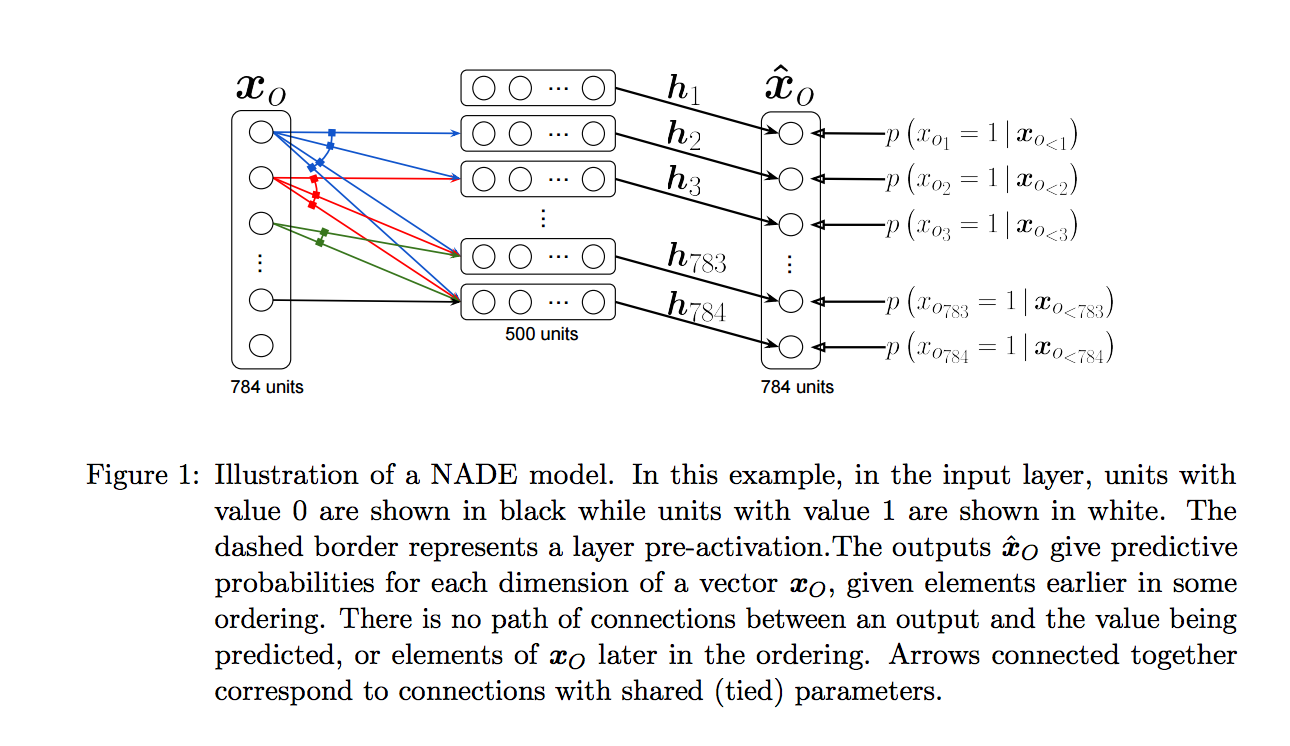
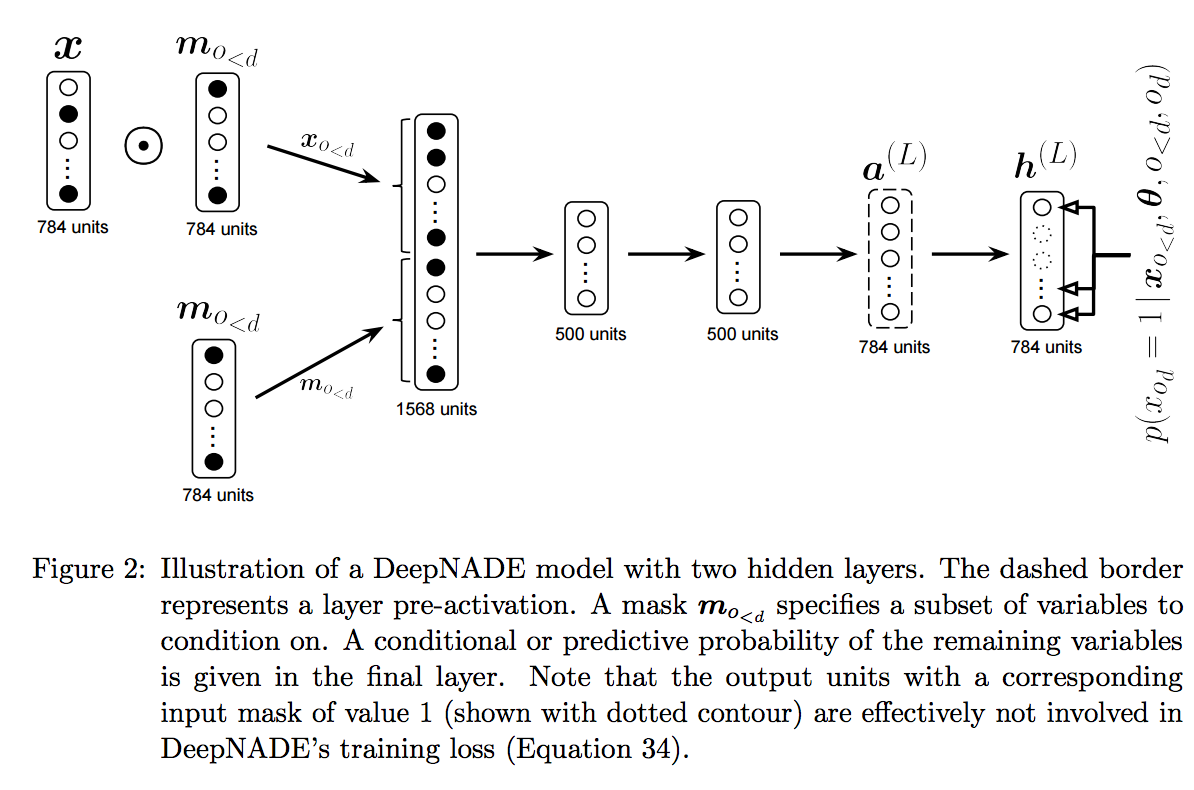
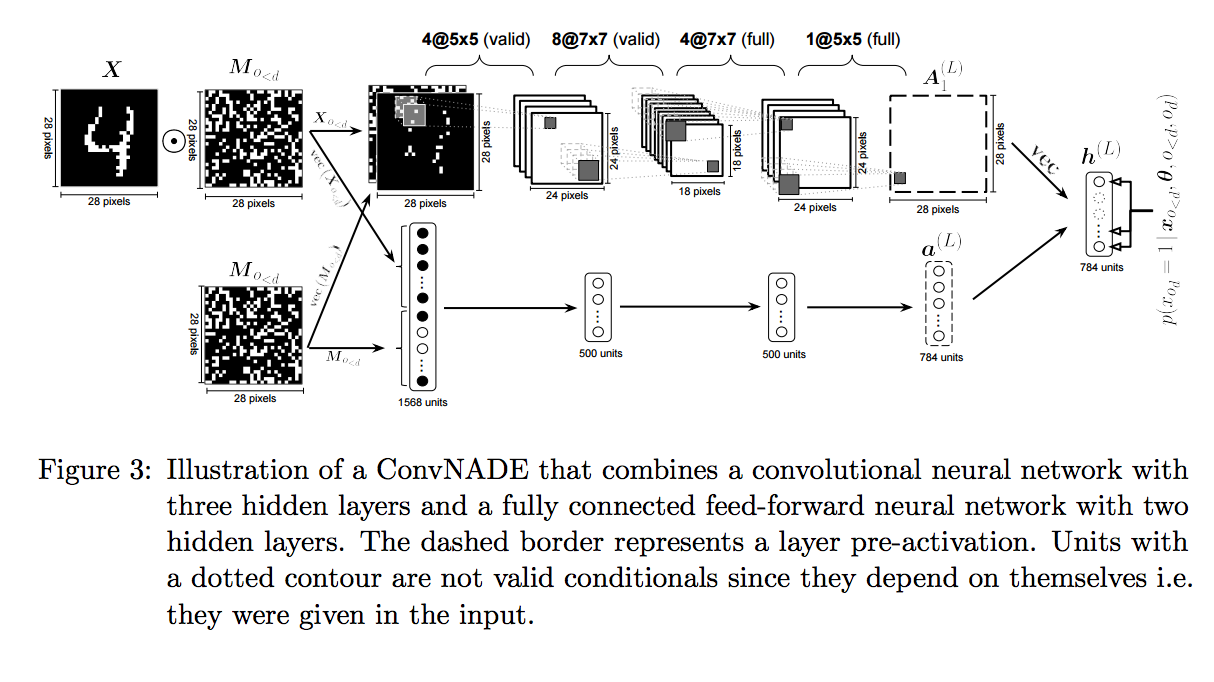
In deep architectures, NADE used masks in a slightly different way than MADE. That is the input to network is the concatenation of the masked data and the mask itself (Figure 2). This allows the network to identify cases when input data is truly zero from cases when input data is zero because of the mask. NADE also explored other autoencoder architectures such as convolutional neural networks (Figure 3).
Results:
MADE
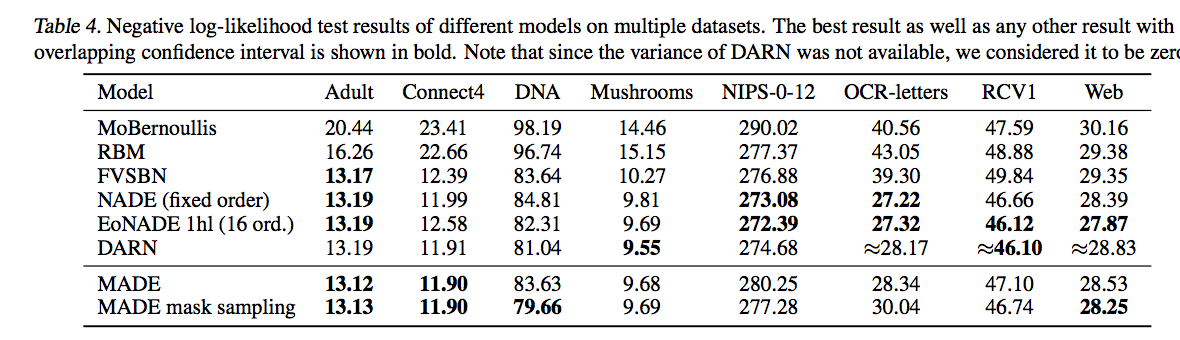
MADE was trained on UCI binary datasets using stochastic gradient descent with mini-batches of size 100 and a lookahead of 30 for early stopping. The results are quantified by the average negative-likelihood on the test set of each data.
The results for the UCI data shows that MADE is the best performing model on almost half of the tested datasets (Table 4).
NADE
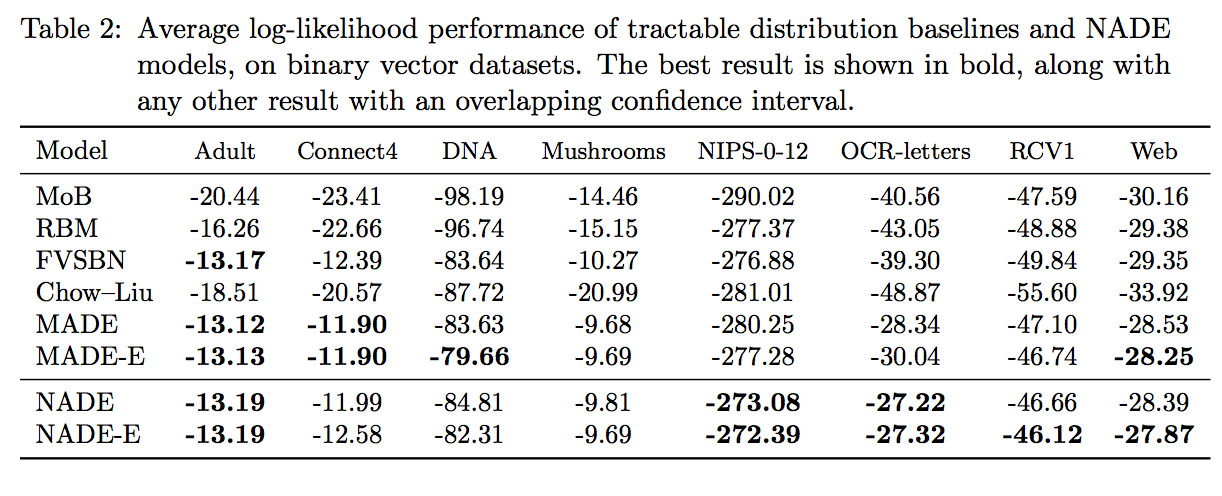
NADE has more extensive experimental section. Here, I discuss the results on the UCI datasets classification experiments. Table 2 in NADE compares the log likelihood performance to other datasets and to also MADE. In these experiments, both NADE and MADE were better than other models in many cases. The performance of NADE and MADE were similar in almost all the datasets, but NADE was slightly better.
Conclusions
Both NADE and MADE are methods motivated by the idea of modeling valid distributions using autoregressive property. The two methods modify autoencoder networks to enforce the autoregressive property on the network weights. The two methods successfully identify valid joint distributions while avoiding trivial solutions and intractable normalization constants. NADE takes the idea of autoregressive models one step further by additionally estimating the distributions of non-binary data and to other network architecture like convolutional networks.
References
[1] Germain, Mathieu, et al. “MADE: masked autoencoder for distribution estimation.” International Conference on Machine Learning. 2015. link
[2] Uria, Benigno, et al. “Neural Autoregressive Distribution Estimation.” arXiv preprint arXiv:1605.02226 (2016). link
[3] Max Welling, Michal Rosen-Zvi, and Geoffrey E. Hinton. Exponential family harmoniums with an application to information retrieval. In Advances in Neural Information Processing Systems 17, pages 1481–1488. MIT Press, 2005.link